
Distributed software can have many pieces. Let’s say you have a company built around a relatively simple app with some accounts, data management, and reporting capabilities. Your list of components might look like this:
- API
- Database
- Monitoring
- Alerting
- Reporting
- Notifications
- Mobile Client App
- Load Balancer
Let’s pretend you have this app and it’s starting to gain some popularity. You’ve hired expert teams for each of these components to keep them running. Each team is working diligently to add requested features and fix bugs in their component. Each team uses impact metrics to figure out which things they should work on first. Each team decides to live with some bugs that appear to affect only a small percentage of users so they can focus high-impact, flashier features.
What happens to the overall quality in this scenario?
Consider that the effective quality from the user perspective cannot be understood by analyzing only a single component. For example, the mobile client might be bug free, but if the API has a 10% failure rate then the app still fails to do what the user wants 10% of the time. The user’s experience of the app quality is therefore 90%.
If your load balancer also only works 90% of the time, then your user’s experience of app quality would be 90% of 90%, or 81%. It’s clear then that the effective quality of any system is a function of the quality of its parts. Naively you can just calculate the product of the reliability rate of each component and you’ll have a pretty good sense of how reliable the whole service is.
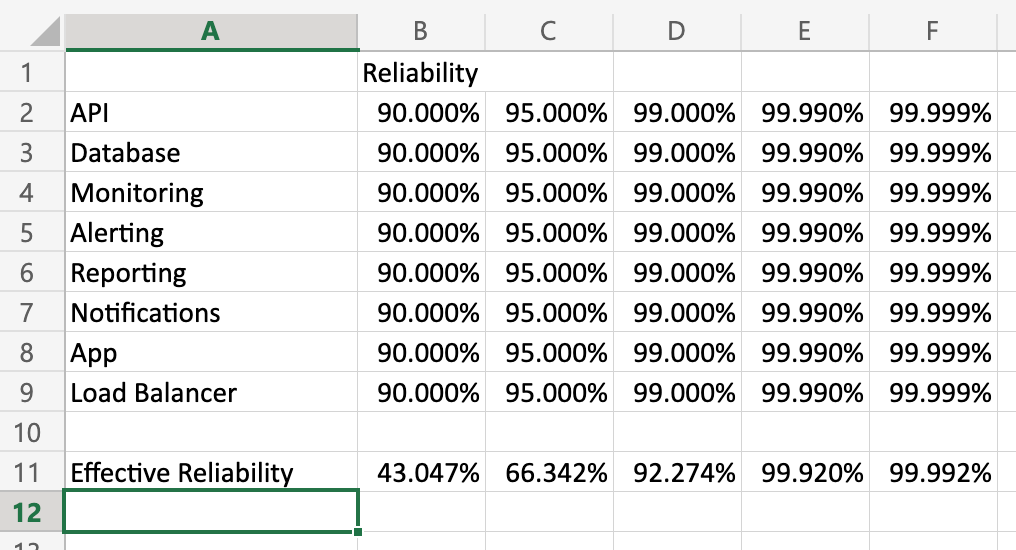
I put together a little spreadsheet to show what happens to effective reliability at different reliability rates for the components:
(Feel free to download this workbook and play with the numbers to see how they impact reliability.)
I learned from a colleague that Motorola figured this out in the 80’s. They learned that in order for their products to meet their reliability standards, the reliability of their parts had to meet the quality bar to the sixth standard deviation. They accordingly called this approach to quality Six Sigma.
Aside: “Six Sigma,” like “Agile,” “Devops,” and myriad other terms suffers from the fad phenomenon of businesses slapping labels on what they’re already doing and claiming progress. Later they claim that the thing they didn’t actually try failed. If you’ve been a part of one of these efforts, don’t throw the baby out with the bathwater.
When I started playing with these numbers a couple of things became apparent to me:
- Seeming small shifts in quality at a component level can have an outsize impact on effective reliability.
- The more components you have, the more susceptible the system is to failure modes. This has important ramifications for the cost/benefit analysis for architectures like micro-services.
Is My Organizational Structure Wrong?
Yes, but only because all organizational structures are wrong for some of your organization’s purposes  . Organizational structure can be an impediment to delivering a good service if the priorities of participating teams are not aligned, but it doesn’t have to be.
In the above example each team risks becoming silo’d around their component. It is the job of management to keep all the team’s focus on the quality of the service or capability that these assets exist for. If teams start invoking the law of diminishing returns with respect to fixing defects or the 80/20 rule with respect to quality issues in the service before reaching 4 or 5 9’s of reliability, they are probably not thinking about the needs of the service anymore.
Ideally, it would be one team responsible for delivering the capability. But as the the org and complexity of the service grows, this may no longer be feasible. In these scenarios management should drive the right prioritization of work by getting reliability metrics per component and publicizing how they impact the service you’re trying to deliver. This would help keep team’s eyes focused on the goal–delivering the service–instead of just their local metric.
